← すべてのスキル
データ映像
数字の中の物語を見つけ、正しい比率で描く。出典を画面に、音楽付き。
使い方
- 1インストール用プロンプトをコピーして、エージェントに貼り付けます。
- 2エージェントが mo doctor で Node.js・FFmpeg・Chrome を確認し、足りないものがあれば入れ方を案内します。
- 3素材を渡すと、お使いのパソコンで MP4 を書き出します。直したいところは言葉で伝えるだけです。
Claude Code、Codex、Cursor などスキルに対応したエージェントに貼り付けてください。
このスキルで作った映像
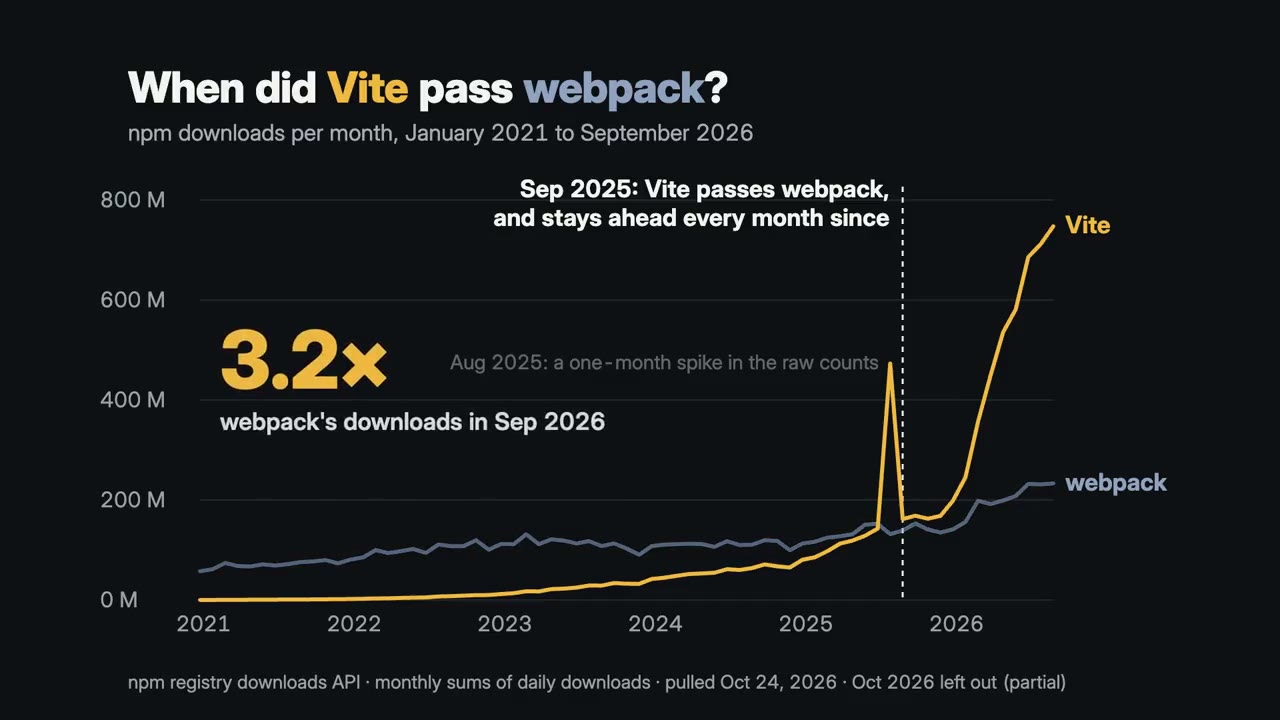
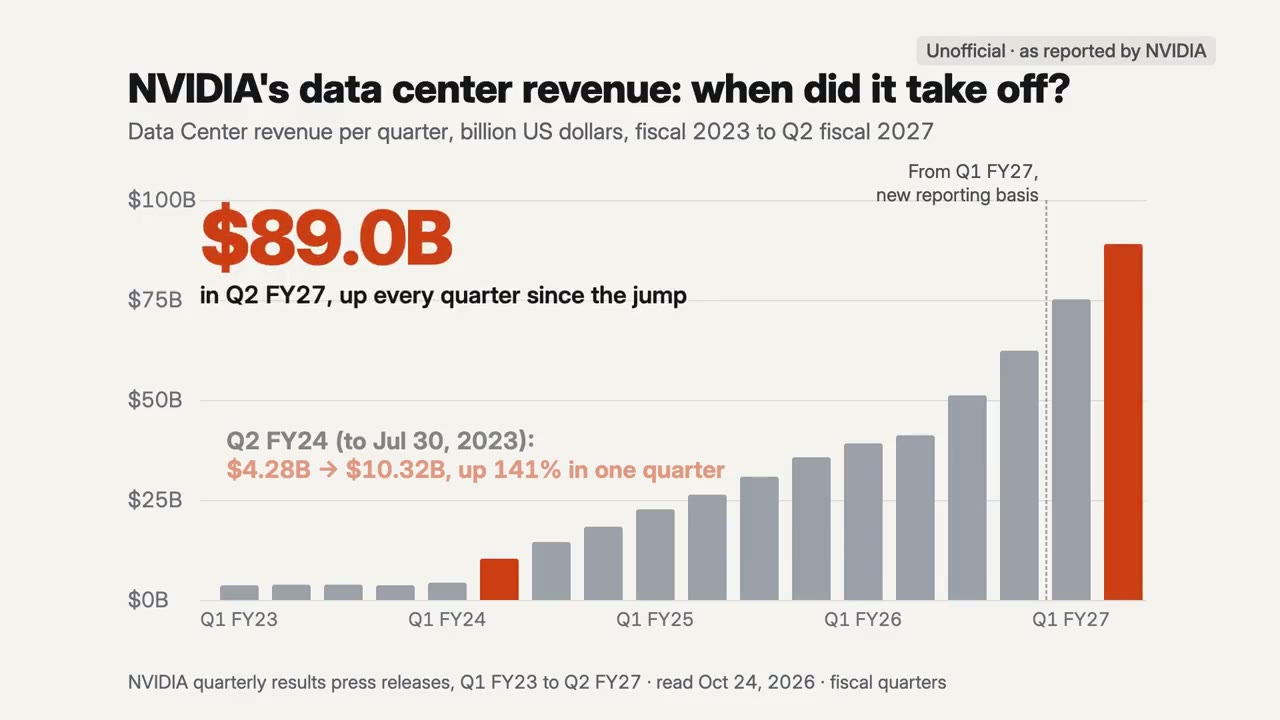
始めるのに必要なのは
API キー不要これだけで始められます
- 表やデータ
依存環境
Node.js 22+、FFmpeg、Chrome。API キー不要。
始める前に、エージェントが mo doctor で Node.js・FFmpeg・Chrome を確認し、足りないものは入れ方を案内します。このスキルにほかに必要なもの(字幕用の whisper など)があれば、説明に書いてあります。
プロンプト例
Use the data-director skill to turn this CSV into a 25-second film about the month we passed 10,000 users.
スタイルプロンプト(Claude Motion または Opus 5.5)
Make a 25-second 16:9 film from the attached data about [the point, e.g for [who will watch, e.g. people who follow our updates]. when our signups passed our waitlist]. Draw the chart on one scale from zero, at a steady rate, label anything unusual in the data where it is, and land the point on the music's lift. Keep the source and the date on screen. Use only the data and source I give below; don't change a word or number. End on the point and the source, held for 3 seconds.

Data: [file or link]
Point: [one sentence]
インストールは不要です。Claude Motion(Team または Enterprise)に貼り付けるか、Opus 5.5 に渡すと、近いルックになります。結果は実行のたびに変わります。スキルなら、手持ちの素材をもとに、お使いのパソコンで書き出します。