← 全部 Skill
數據片
從你的數字裡找到故事,按真實比例畫出來,出處寫在畫面上,附配樂。
怎麼用
- 1複製安裝提示詞,貼給你的 Agent。
- 2Agent 先執行 mo doctor,檢查 Node.js、FFmpeg 和 Chrome;缺什麼會告訴你怎麼裝。
- 3把素材交給它,它會在你的電腦上算圖輸出 MP4;想改哪裡,直接說。
貼到 Claude Code、Codex、Cursor 或任何支援 Skill 的 Agent。
用它做出來的片子
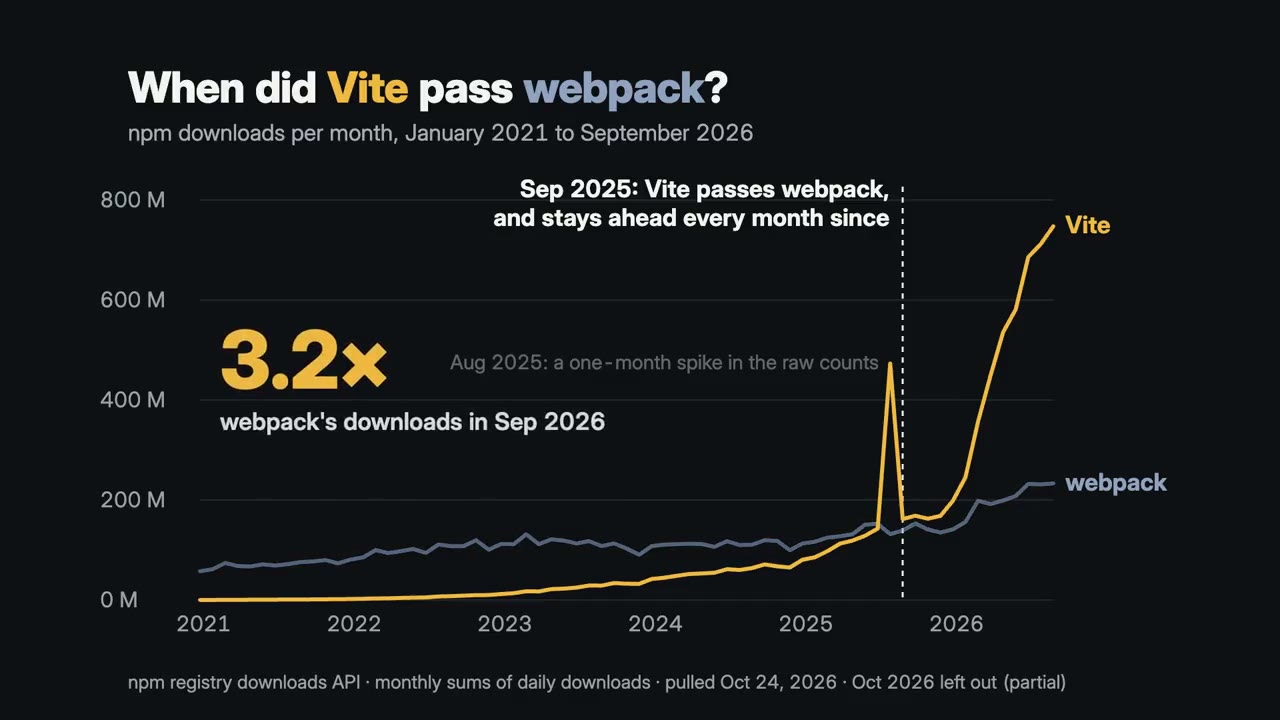
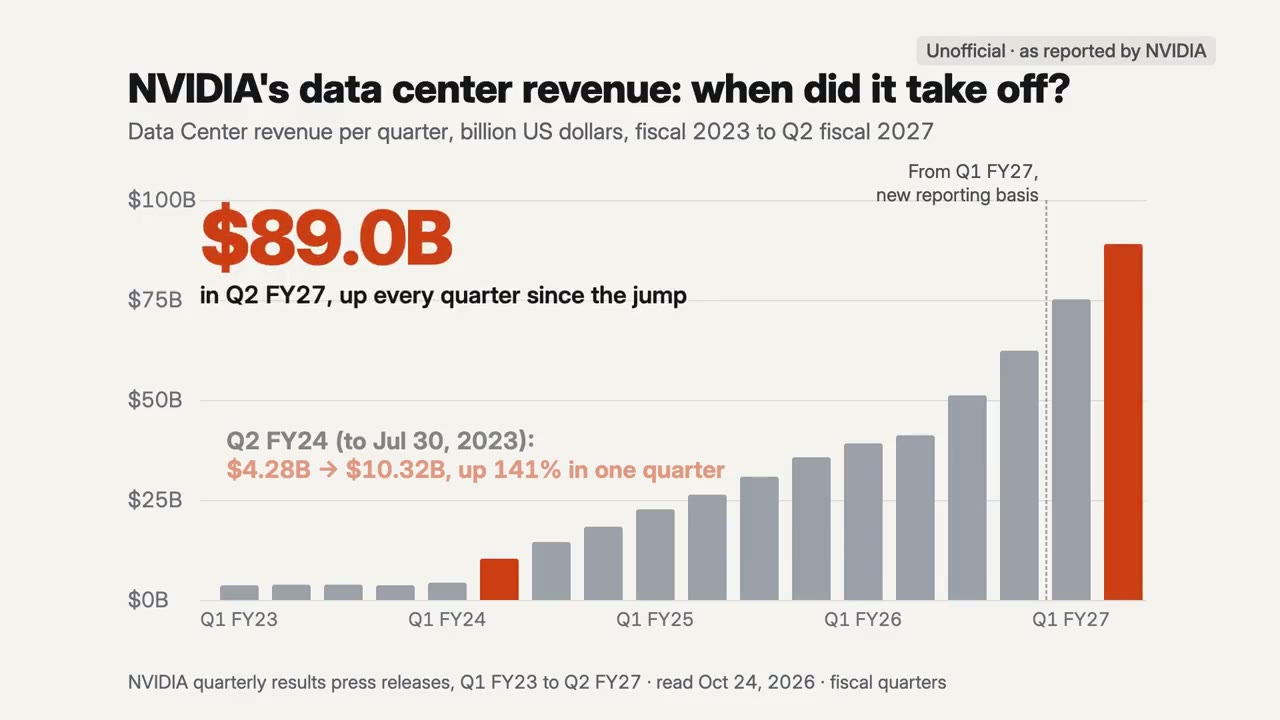
開始只需要
無需 API Key有這個就能開始
- 試算表或資料
執行環境
Node.js 22+、FFmpeg、Chrome。不需要 API Key。
開始前,Agent 會執行 mo doctor 檢查 Node.js、FFmpeg 和 Chrome,缺什麼會告訴你怎麼裝;如果這個 Skill 還需要別的(例如字幕要用的 whisper),它的說明裡會寫明。
範例提示詞
Use the data-director skill to turn this CSV into a 25-second film about the month we passed 10,000 users.
風格提示詞(Claude Motion 或 Opus 5.5)
Make a 25-second 16:9 film from the attached data about [the point, e.g for [who will watch, e.g. people who follow our updates]. when our signups passed our waitlist]. Draw the chart on one scale from zero, at a steady rate, label anything unusual in the data where it is, and land the point on the music's lift. Keep the source and the date on screen. Use only the data and source I give below; don't change a word or number. End on the point and the source, held for 3 seconds.

Data: [file or link]
Point: [one sentence]
無需安裝:貼到 Claude Motion(Team 或 Enterprise),或直接傳給 Opus 5.5,就能得到相近的風格。每次執行結果會有差異;用 Skill 則根據你的素材,在你的電腦上算圖。