← All skills
Data Video
Finds the story in your numbers and draws it to scale, with the source on screen and music.
Data Video: its example films and styles →
How it works
- 1Copy the install prompt and paste it into your agent.
- 2Your agent runs mo doctor to check Node.js, FFmpeg and Chrome, and tells you how to install anything missing.
- 3Give it your material. It renders an MP4 on your computer, and you ask for changes in plain words.
Paste into Claude Code, Codex, Cursor or any agent that supports skills.
Films it made
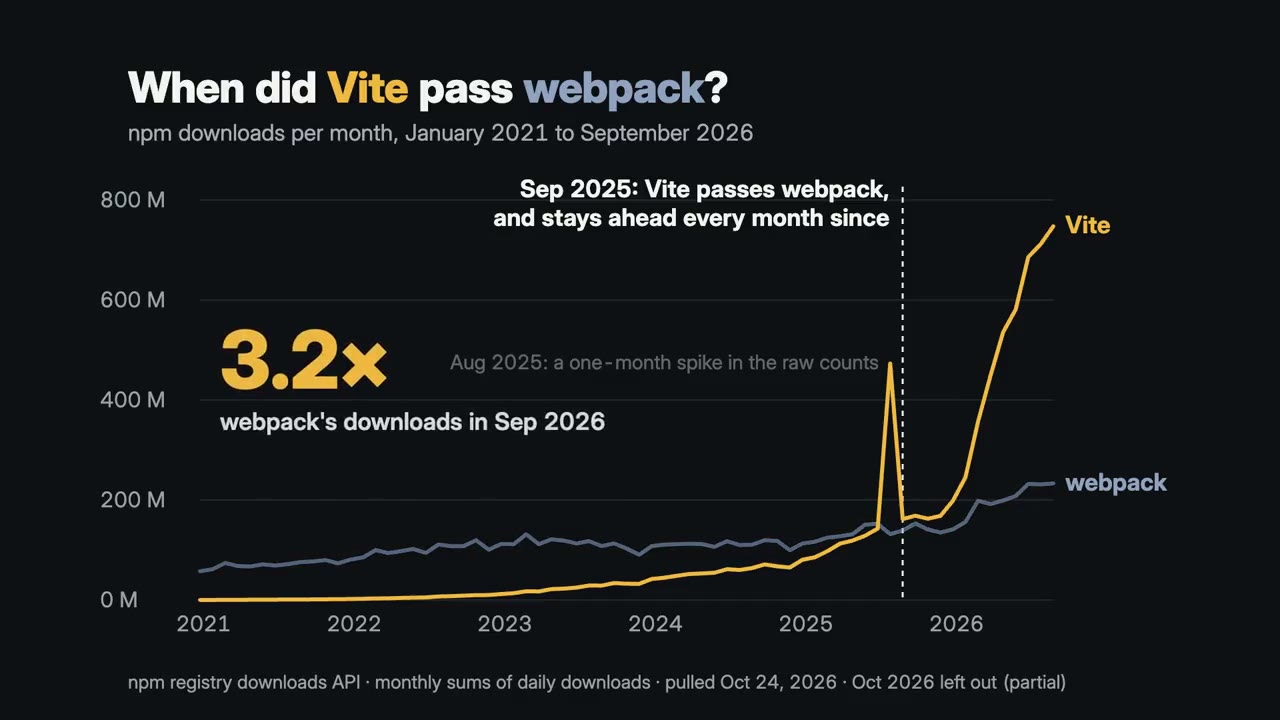
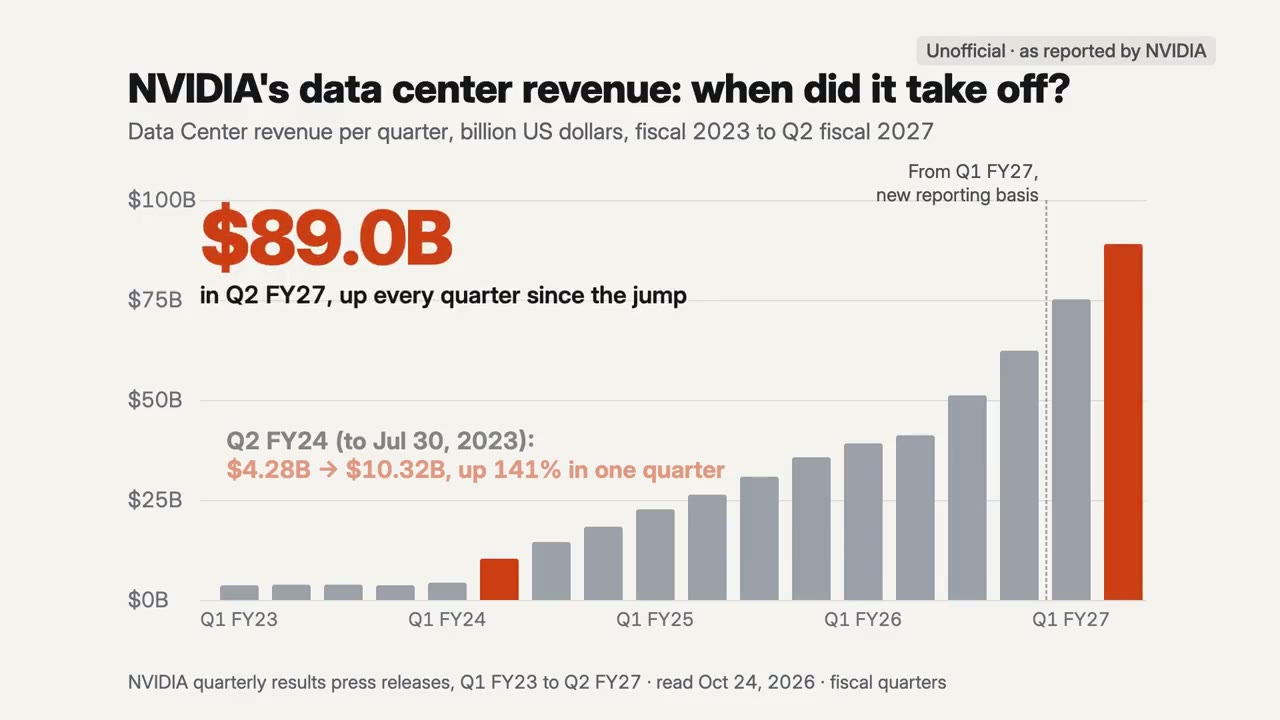
All it takes
No API keyThis is all it needs
- A spreadsheet or data
Dependencies
Node.js 22+, FFmpeg, Chrome. No API keys.
Before it starts, your agent runs mo doctor to check Node.js, FFmpeg and Chrome and tells you how to install anything missing; if this skill needs more (such as whisper for captions), its instructions say so.
Example prompt
Use the data-director skill to turn this CSV into a 25-second film about the month we passed 10,000 users.
Style prompt (Claude Motion or Opus 5.5)
Make a 25-second 16:9 film from the attached data about [the point, e.g for [who will watch, e.g. people who follow our updates]. when our signups passed our waitlist]. Draw the chart on one scale from zero, at a steady rate, label anything unusual in the data where it is, and land the point on the music's lift. Keep the source and the date on screen. Use only the data and source I give below; don't change a word or number. End on the point and the source, held for 3 seconds.

Data: [file or link]
Point: [one sentence]
Nothing to install: paste this into Claude Motion (Team or Enterprise) or give it to Opus 5.5 for a similar look. The result changes from run to run; the skill works from your own material and renders on your computer.